In order to generate zonal stats for an area (or areas) of interest (aoi) , we have come up with the concept of an aggregation specification or agg spec, which is a way to specify what aggregation functions (such as count,sum, mean,std etc.) are to be applied to columns in the source dataframe (data).
The method create_zonal_stats can then take in a list of these agg specs and apply them to create zonal stats from the data for the aoi.
Each agg spec consists of a dict with the following keys:
func: (Required) a str or a list [str] of aggregation functions. See the pandas documentation for agg
column: (Optional) an existing column in the data to generate the zonal statistic from. If not specified, the grouping key based on the index of the aoi applied to the data is used as default.
output: (Optional) a str or a list [str] of the name(s) of the output zonal statistic column. If not specified it is concatenated from the column and func i.e. {column}_{func} (e.g. 'func':'mean' on 'column':'population' has a default value 'output':'population_mean')
fillna: (Optional) a bool or a list [bool] of the flag(s) that indicates whether to to a fillna(0) step for the new zonal column, True meaning it will set any NA values in the resulting zonal stat to 0, and False will retain any NA values. The default value of the flag(s) is False.
Examples
The simplest aggregation spec. This will result in an output column named index_count as it will use the aoi index as the default column.
{"func":"count"}
The sum function is applied to the data column population which will create an output column named total_population.
Compute the zonal stats mean,sum,max on the population column and rename the output columns (by default) to population_mean, population_sum and population_max.
A full aggregation spec with fillna. fillna == False for std means it will remain an NA if there is no data for the column in the group. The default value for fillna is True which means that 0 is used to replace any NA in the output column.
The agg spec in the list of aggregations can contain the same columns, but the output columns must be unique since they will added as columns in the results.
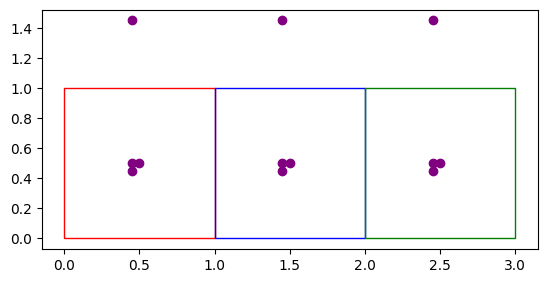
Regular and Grid Zonal Stats
Vector zonal stats for user defined areas and grids (e.g. Admin areas)
def create_zonal_stats( aoi:GeoDataFrame, # Area of interest for which zonal stats are to be computed for data:GeoDataFrame, # Source gdf containing data to compute zonal stats from aggregations:List, # List of agg specs, with each agg spec applied to a data column overlap_method:str='intersects', # spatial predicate to used in spatial join of aoi and data [geopandas.sjoin](https://geopandas.org/en/stable/docs/user_guide/mergingdata.html#binary-predicate-joins) for more details)->GeoDataFrame: # categorical_column_options: str = None,
Create zonal stats for area of interest from data using aggregration operations on data columns. Returns the same aoi with additional columns containing the computed zonal features.
def compute_quadkey( data:GeoDataFrame, # The geodataframe zoom_level:int, # The quadkey zoom level (1-23) quadkey_column:str='quadkey', # The name of the quadkey output column)->GeoDataFrame:
Computes the quadkeys for the geometries of the data. If geometries are not points, the quadkeys are computed from the centroids of the geometries.
If our existing data geodataframe doesn’t have quadkeys, we can use the compute_quadkey to generate the quadkeys for the centroid of the data’s geometries.
def create_bingtile_zonal_stats( aoi:DataFrame, # An aoi with quadkey column data:DataFrame, # Data with quadkey column aggregations:List, # List of agg specs, with each agg spec applied to a data column aoi_quadkey_column:str='quadkey', # Column name of aoi quadkey data_quadkey_column:str='quadkey', # Column name of data quadkey)->DataFrame:
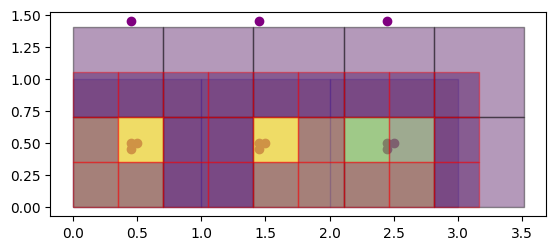
To create bingtile zonal stats, we need to compute the quadkeys for the areas of interest (AOI) and the data.
The geowrangler.grids module provides a BingTileGridGenerator that will generate the quadkeys for the areas covered by your AOIs.
Using the data with the computed quadkeys, we can generate zonal stats for our bingtile grid aois. This just uses the regular pandas grouping and merging function and skips any geospatial joins which results in faster computation.