simple_aoi| geometry | |
|---|---|
| 0 | POLYGON ((0 0, 0 1, 1 1, 1 0, 0 0)) |
| 1 | POLYGON ((1 0, 1 1, 2 1, 2 0, 1 0)) |
| 2 | POLYGON ((2 0, 2 1, 3 1, 3 0, 2 0)) |
| 3 | POLYGON ((3 0, 3 1, 4 1, 4 0, 3 0)) |
| 4 | POLYGON ((4 0, 4 1, 5 1, 5 0, 4 0)) |
![]()
def create_area_zonal_stats(
    aoi:GeoDataFrame, # Area of interest for which zonal stats are to be computed for
    data:GeoDataFrame, # Source gdf of region/areas containing data to compute zonal stats from
    aggregations:List=[], # List of agg specs, with each agg spec applied to a data column
    include_intersect:bool=True, # Add column 'intersect_area_sum' w/ch computes total area of data areas intersecting aoi
    fix_min:bool=True, # Set min to zero if there are areas in aoi w/ch do not containing any intersecting area from the data.
):
Given an aoi (simple_aoi) and geodataframe containing sample data (simple_data)
simple_aoi| geometry | |
|---|---|
| 0 | POLYGON ((0 0, 0 1, 1 1, 1 0, 0 0)) |
| 1 | POLYGON ((1 0, 1 1, 2 1, 2 0, 1 0)) |
| 2 | POLYGON ((2 0, 2 1, 3 1, 3 0, 2 0)) |
| 3 | POLYGON ((3 0, 3 1, 4 1, 4 0, 3 0)) |
| 4 | POLYGON ((4 0, 4 1, 5 1, 5 0, 4 0)) |
simple_data| geometry | population | internet_speed | |
|---|---|---|---|
| 0 | POLYGON ((0.25 0, 0.25 1, 1.25 1, 1.25 0, 0.25... | 100 | 20.0 |
| 1 | POLYGON ((1.25 0, 1.25 1, 2.25 1, 2.25 0, 1.25... | 200 | 10.0 |
| 2 | POLYGON ((2.25 0, 2.25 1, 3.25 1, 3.25 0, 2.25... | 300 | 5.0 |
ax = plt.axes()
ax = simple_data.plot(
    ax=ax, color=["orange", "brown", "purple"], edgecolor="yellow", alpha=0.4
)
ax = simple_aoi.plot(
    ax=ax, facecolor="none", edgecolor=["r", "g", "b", "orange", "purple"]
)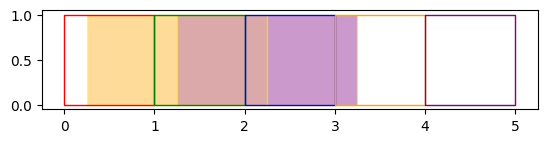
The red,green,blue, orange and purple outlines are the 5 regions of interest (aoi) while the orange,brown, purple areas are the data areas.
empty_aoi_results = create_area_zonal_stats(simple_aoi, simple_data)empty_aoi_results| geometry | intersect_area_sum | |
|---|---|---|
| 0 | POLYGON ((0 0, 0 1, 1 1, 1 0, 0 0)) | 0.75 |
| 1 | POLYGON ((1 0, 1 1, 2 1, 2 0, 1 0)) | 1.00 |
| 2 | POLYGON ((2 0, 2 1, 3 1, 3 0, 2 0)) | 1.00 |
| 3 | POLYGON ((3 0, 3 1, 4 1, 4 0, 3 0)) | 0.25 |
| 4 | POLYGON ((4 0, 4 1, 5 1, 5 0, 4 0)) | 0.00 |
simple_aoi_results = create_area_zonal_stats(
    simple_aoi,
    simple_data,
    [
        dict(func="count", output="sample_count"),
        dict(func=["sum", "count"], column="population"),
        dict(func=["mean", "max", "min", "std"], column="internet_speed"),
    ],
)
CPU times: user 11.3 ms, sys: 1.23 ms, total: 12.5 ms
Wall time: 12.9 mssimple_aoi_results| geometry | intersect_area_sum | sample_count | population_sum | population_count | internet_speed_mean | internet_speed_max | internet_speed_min | internet_speed_std | |
|---|---|---|---|---|---|---|---|---|---|
| 0 | POLYGON ((0 0, 0 1, 1 1, 1 0, 0 0)) | 0.75 | 1.0 | 75.0 | 1.0 | 15.000 | 20.0 | 0.0 | NaN |
| 1 | POLYGON ((1 0, 1 1, 2 1, 2 0, 1 0)) | 1.00 | 2.0 | 175.0 | 2.0 | 6.250 | 20.0 | 10.0 | 7.071068 |
| 2 | POLYGON ((2 0, 2 1, 3 1, 3 0, 2 0)) | 1.00 | 2.0 | 275.0 | 2.0 | 3.125 | 10.0 | 5.0 | 3.535534 |
| 3 | POLYGON ((3 0, 3 1, 4 1, 4 0, 3 0)) | 0.25 | 1.0 | 75.0 | 1.0 | 1.250 | 5.0 | 0.0 | NaN |
| 4 | POLYGON ((4 0, 4 1, 5 1, 5 0, 4 0)) | 0.00 | NaN | NaN | NaN | NaN | NaN | 0.0 | NaN |
simple_aoi_results.population_sum.sum(axis=None)np.float64(600.0)corrected_aoi_results = create_area_zonal_stats(
simple_aoi,
simple_data,
[
dict(func=["sum", "count"], column="population"),
dict(
func=["mean", "imputed_mean", "raw_max", "raw_min", "raw_std"],
column="internet_speed",
output=[
"internet_speed_mean",
"internet_speed_imputed_mean",
"internet_speed_max",
"internet_speed_min",
"internet_speed_std",
],
),
],
fix_min=False,
)CPU times: user 11.7 ms, sys: 849 µs, total: 12.5 ms
Wall time: 12.1 mscorrected_aoi_results| geometry | intersect_area_sum | population_sum | population_count | internet_speed_mean | internet_speed_imputed_mean | internet_speed_max | internet_speed_min | internet_speed_std | |
|---|---|---|---|---|---|---|---|---|---|
| 0 | POLYGON ((0 0, 0 1, 1 1, 1 0, 0 0)) | 0.75 | 75.0 | 1.0 | 15.000 | 20.000 | 20.0 | 20.0 | NaN |
| 1 | POLYGON ((1 0, 1 1, 2 1, 2 0, 1 0)) | 1.00 | 175.0 | 2.0 | 6.250 | 6.250 | 20.0 | 10.0 | 7.071068 |
| 2 | POLYGON ((2 0, 2 1, 3 1, 3 0, 2 0)) | 1.00 | 275.0 | 2.0 | 3.125 | 3.125 | 10.0 | 5.0 | 3.535534 |
| 3 | POLYGON ((3 0, 3 1, 4 1, 4 0, 3 0)) | 0.25 | 75.0 | 1.0 | 1.250 | 5.000 | 5.0 | 5.0 | NaN |
| 4 | POLYGON ((4 0, 4 1, 5 1, 5 0, 4 0)) | 0.00 | NaN | NaN | NaN | NaN | NaN | NaN | NaN |
aois_no_nas = create_area_zonal_stats(
    simple_aoi,
    simple_data,
    [
        dict(func=["sum", "count"], column="population", fillna=[True, True]),
        dict(
            func=["mean", "imputed_mean", "raw_max", "raw_min", "raw_std"],
            column="internet_speed",
            output=[
                "internet_speed_mean",
                "internet_speed_imputed_mean",
                "internet_speed_max",
                "internet_speed_min",
                "internet_speed_std",
            ],
            fillna=[True, True, True, True, True],
        ),
    ],
    fix_min=False,
)
CPU times: user 12.1 ms, sys: 679 µs, total: 12.8 ms
Wall time: 12.3 msaois_no_nas| geometry | intersect_area_sum | population_sum | population_count | internet_speed_mean | internet_speed_imputed_mean | internet_speed_max | internet_speed_min | internet_speed_std | |
|---|---|---|---|---|---|---|---|---|---|
| 0 | POLYGON ((0 0, 0 1, 1 1, 1 0, 0 0)) | 0.75 | 75.0 | 1.0 | 15.000 | 20.000 | 20.0 | 20.0 | 0.000000 |
| 1 | POLYGON ((1 0, 1 1, 2 1, 2 0, 1 0)) | 1.00 | 175.0 | 2.0 | 6.250 | 6.250 | 20.0 | 10.0 | 7.071068 |
| 2 | POLYGON ((2 0, 2 1, 3 1, 3 0, 2 0)) | 1.00 | 275.0 | 2.0 | 3.125 | 3.125 | 10.0 | 5.0 | 3.535534 |
| 3 | POLYGON ((3 0, 3 1, 4 1, 4 0, 3 0)) | 0.25 | 75.0 | 1.0 | 1.250 | 5.000 | 5.0 | 5.0 | 0.000000 |
| 4 | POLYGON ((4 0, 4 1, 5 1, 5 0, 4 0)) | 0.00 | 0.0 | 0.0 | 0.000 | 0.000 | 0.0 | 0.0 | 0.000000 |