simple_aoi| geometry | |
|---|---|
| 0 | POLYGON ((0 0, 0 1, 1 1, 1 0, 0 0)) |
| 1 | POLYGON ((1 0, 1 1, 2 1, 2 0, 1 0)) |
| 2 | POLYGON ((2 0, 2 1, 3 1, 3 0, 2 0)) |
![]()
def create_distance_zonal_stats(
    aoi:GeoDataFrame, # Area of interest for which zonal stats are to be computed for
    data:GeoDataFrame, # Source gdf of region/areas containing data to compute zonal stats from
    max_distance:float, # max distance to compute distance for (the larger the slower the join), set to None for no limit
    aggregations:List=[], # aggregations
    distance_col:str='nearest', # column name of the distance column, set to None if not wanted in results
):
Computes zonal stats based on nearest matching data geometry within max_distance. Note that setting a too high max_distance (or None) will incur a performance cost.
Given an aoi (simple_aoi) and geodataframe containing sample data (simple_data)
simple_aoi| geometry | |
|---|---|
| 0 | POLYGON ((0 0, 0 1, 1 1, 1 0, 0 0)) |
| 1 | POLYGON ((1 0, 1 1, 2 1, 2 0, 1 0)) |
| 2 | POLYGON ((2 0, 2 1, 3 1, 3 0, 2 0)) |
simple_data| geometry | population | internet_speed | |
|---|---|---|---|
| 0 | POLYGON ((0.25 0, 0.25 1, 1.25 1, 1.25 0, 0.25... | 100 | 20.0 |
| 1 | POLYGON ((1.25 0, 1.25 1, 2.25 1, 2.25 0, 1.25... | 200 | 10.0 |
| 2 | POLYGON ((2.25 0, 2.25 1, 3.25 1, 3.25 0, 2.25... | 300 | 5.0 |
We also have simple point data which do not intersect with our AOIs.
simple_point_data| geometry | population | internet_speed | |
|---|---|---|---|
| 0 | POINT (0.5 3) | 100 | 20.0 |
| 1 | POINT (0.5 4) | 600 | 120.0 |
| 2 | POINT (0.5 5) | 1100 | 220.0 |
| 3 | POINT (0.5 6) | 1600 | 320.0 |
| 4 | POINT (0.5 7) | 2100 | 420.0 |
| 5 | POINT (1.5 3) | 200 | 10.0 |
| 6 | POINT (1.5 4) | 700 | 110.0 |
| 7 | POINT (1.5 5) | 1200 | 210.0 |
| 8 | POINT (1.5 6) | 1700 | 310.0 |
| 9 | POINT (1.5 7) | 2200 | 410.0 |
| 10 | POINT (2.5 3) | 300 | 5.0 |
| 11 | POINT (2.5 4) | 800 | 105.0 |
| 12 | POINT (2.5 5) | 1300 | 205.0 |
| 13 | POINT (2.5 6) | 1800 | 305.0 |
| 14 | POINT (2.5 7) | 2300 | 405.0 |
ax = plt.axes()
ax = simple_data.plot(
    ax=ax, color=["orange", "brown", "purple"], edgecolor="yellow", alpha=0.4
)
ax = simple_aoi.plot(ax=ax, facecolor="none", edgecolor=["r", "g", "b"])
ax = simple_point_data.plot(ax=ax)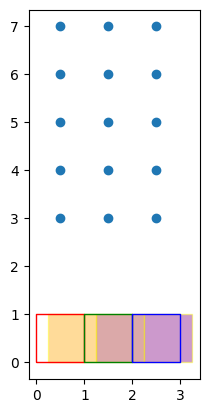
The red,green,blue outlines are the 3 regions of interest (aoi) while the orange,brown, purple areas are the data areas.The blue dots are data which do not intersect our AOIs.
results = create_distance_zonal_stats(
    simple_aoi,
    simple_point_data,
    max_distance=7,
    aggregations=[
        dict(func="count"),
        dict(func="sum", column="population"),
        dict(func="mean", column="internet_speed"),
    ],
)
CPU times: user 6.33 ms, sys: 1.07 ms, total: 7.4 ms
Wall time: 7.26 msresults| geometry | index_count | population_sum | internet_speed_mean | nearest | |
|---|---|---|---|---|---|
| 0 | POLYGON ((0 0, 0 1, 1 1, 1 0, 0 0)) | 1 | 100 | 20.0 | 2.0 |
| 1 | POLYGON ((1 0, 1 1, 2 1, 2 0, 1 0)) | 1 | 200 | 10.0 | 2.0 |
| 2 | POLYGON ((2 0, 2 1, 3 1, 3 0, 2 0)) | 1 | 300 | 5.0 | 2.0 |
results2 = create_distance_zonal_stats(
    simple_aoi,
    simple_data,
    max_distance=1,
    aggregations=[
        dict(func="count"),
        dict(func="sum", column="population"),
        dict(func="mean", column="internet_speed"),
    ],
)
CPU times: user 4.56 ms, sys: 203 µs, total: 4.76 ms
Wall time: 4.7 msresults2| geometry | index_count | population_sum | internet_speed_mean | nearest | |
|---|---|---|---|---|---|
| 0 | POLYGON ((0 0, 0 1, 1 1, 1 0, 0 0)) | 1 | 100 | 20.0 | 0.0 |
| 1 | POLYGON ((1 0, 1 1, 2 1, 2 0, 1 0)) | 2 | 300 | 15.0 | 0.0 |
| 2 | POLYGON ((2 0, 2 1, 3 1, 3 0, 2 0)) | 2 | 500 | 7.5 | 0.0 |